| |
|
|
Tutorial
1. Description of MDLovoFit capabilites and expected results.
Read this to understand what to get from the package.
2. Step by step tutorial on how to use the
package in your simulation.
Follow the tutorial and get the results from your simulation.
1. Description of MDLovoFit capabilites and expected
results.
First, we will show which information is expected from
the usage of this package. Two plots are characteristic of the analysis
of the data performed by MDLovoFit. Figure 1 illustrates the
analysis of the mobility of a protein structure in a typical MD
simulation:
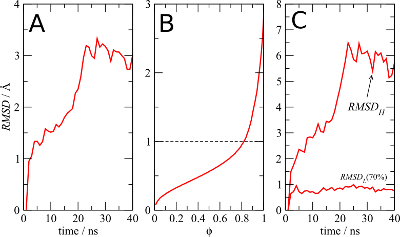
Figure 1
The panel A of Figure 1 shows the standard RMSD of the protein
Cα atoms along the simulation. It indicates that the protein
somewhat diverges from the initial structure.
Figure 1B is the result of running MDLovoFit with the
-mapfrac option. It shows the RMSD of the
alignment of a subset of the atoms, as a function of the size of
this subset, represented as a fraction of the size of the structure.
For each fraction the RMSD is the best possible RMSD that can be
obtained for every possible subset of that size. The plot
shows, for example, that it is possible in this simulation to align
about 80% of the Cα atoms of the structure to less than 1Å
Finally, in figure 1C, the RMSD computed by MDLovoFit for the alignment
of 70% of the Cα atoms is shown. Clearly, the fluctuations of 70%
of the structure are minimal, while there is a small subset of of 30%
of the atoms that deviates from the initial structure and explains
the divergence observed in figure 1A.
The result of figure 1C can, of course, be supported by the
visualization of the resulting alignment. The structural alignment
is shown in Figure 2. This figure can also be
obtained from the output of MDLovoFit (and using
VMD)
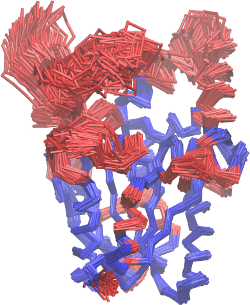
Figure 2
This figure displays, in blue, the 70% of the Cα atoms of
the protein which were automatically identified by MDLovoFit as the
least mobile ones (with RMSD lower than 1Å, as shown in figure
1C). In red, the figure highlights which regions of the structure
are more mobile, and diverge from the initial conformation of the
simulation.
With the plots of figures 1B and 1C, and with the above structural
representation, a more comprehensive view of the mobility of the protein
is obtained. In the next section we
will show how to, in practice, obtain each of these plots.
Additionally, it is possible to plot the RMSF of the atoms, and to use
these data to color the structure, using VMD. See the last section of the
tutorial (next section) for details.
|
|
|
|