| |
|
|
Tutorial
1. Description of MDLovoFit capabilites and
expected results.
Read this to understand what to get from the package.
2. Step by step tutorial on how to use the
package in your simulation.
Follow the tutorial and get the results from your simulation.
2. Step by step tutorial on how to use the package
for your simulation
MDLovoFit reads the trajectories in PDB format. Therefore, the first
step is to obtain that file. A good alternative is to use
VMD. First, open your
simulation trajectory on VMD. Save equally spaced frames of your
trajectory to a PDB file, preferentially with the protein alone, or even
with a subset of the protein of your interest, as illustrated by the
figure below.

Save the coordinates only of the protein, or of the subset of the
protein you might be interested. Use the stride
option so that your PDB file contains about 100 frames (which is
enough for the analysis and the file created is not be very large), as
shown in the next figure. (By default, MDLovoFit will try to align Cα atoms.
To chose different sets of atoms, see the -atoms or -atomsfile options at the
Input Options section.)

Save the PDB trajectory file, as shown in the next figure. Here, we will
call this file "trajectory.pdb".

Now that we have the PDB trajectory file, lets analyze the mobility of
the structure using MDLovoFit.
First, run MDLovoFit using the -mapfrac option:
mdlovofit -mapfrac trajectory.pdb > mapfrac.dat
This run will take a couple of minutes (it has to align all frames of
the trajectory using all possible subsets of the structure). The output file created,
mapfrac.dat will contain the following data:
#  FRACTION   RMSD: BEST ALIGNED          OTHER ATOMS            ALL ATOMS          dBEST/dSTEP
     0.0100          0.074948685          3.079368110          3.051201678          7.494868506
     0.0200          0.109298391          3.070029885          3.014516170          3.434970548
     ...
     0.9900          2.519596102         11.711487170          2.634494740         19.237318186
     1.0000          2.817376673          0.000000000          2.817376673         29.778057072

This plot shows down to which RMSD each fraction of the structure can
be aligned. In this case, we were surprised by the fact that we could
align 70% of the Cα atoms of the protein to less than
1Å RMSD.
Now that we know that at least 70% of the structure can be aligned to
less than 1Å we will compute, in a new run of MDLovoFit, the
time-dependence of the RMSD of the least mobile 70% of the atoms and, at
the same time, the RMSD of the 30% most mobile atoms. This is done by
running MDLovoFit with the same trajectory file, with:
mdlovofit -f 0.7 -t output.pdb trajectory.pdb > rmsd70.dat
The fraction of atoms to be aligned is defined by the first parameter
(-f 0.7), the output file containing the trajectory aligned
with this option is defined by -t output.pdb, and the input
trajectory file, which we created, is the trajectory.pdb
file (some additional options are available, check them at the
Input options section).
The MDLovoFit run above will create the rmsd70.dat file.
This file will be like:
#     FRAME   RMSD: BEST ALIGNED          OTHER ATOMS            ALL ATOMS
          1          0.000000000          0.000000000          0.000000000
          2          0.644350237          1.485878211          0.896808629
        ...
         99          0.895928498          6.666012164          2.626953598
        100          0.842638570          5.966355234          2.379753569
# Average RMSD of least mobile atoms:      0.81601
# Average RMSD of most mobile atoms:       5.20554
# Average RMSD of all atoms:               2.1328
Thus, it contains, for each frame of the trajectory, the RMSD of the 70%
best aligned atoms, the RMSD of the 30% worst aligned atoms, and the
RMSD of all atoms (computed from this alignment). Plotting the second
and third columns of this file as a function of the first, gives a
figure like figure 1C of the first part of the tutorial:

The time-dependence of the RMSDs of the two substructures clearly shows that
there is a 70% subset of the protein which displays only subtle
fluctuations (less than 1Å), and that all structural divergence
can be associated with the 30% more mobile atoms.
The output PDB file of this MDLovoFit run, here output.pdb,
will contain data of the form:
ATOM   1984  O   SER 1 135       0.271  16.134 -17.056  0.00  0.56     1YS1
ATOM   1985  N   SER 1 136       0.216  18.308 -16.313  1.00  1.11     1YS1
At the occupancy column there will be a 0.00 or
1.00, which indicates whether the Cα atom of that
residue was found to be within the least mobile (1.00) or not. Thus,
just open this PDB file in VMD, use the "trace" representation with the
"occupancy" color, and see all frames at once with the
"Draw Multiple Frames", as illustrated below.


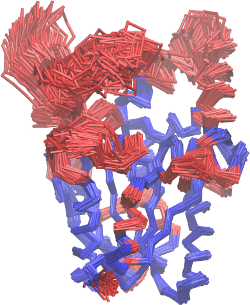
This will give you the structural image of the different mobilities. In
red, the atoms with greater mobility, which were not used explicitly on
the MDLovoFit alignment. In blue, the atoms that are least mobile, and
were used in the alignment. This will correspond to the figure 2 of the
first part of the tutorial, and should look like this:
Visualizing RMSF data on the structure:
A script that allows the visualization of the RMSF over the structure is
also provided. With this script, and VMD, images of the fluctuations
similar to these are obtained:


The figure on the left displays the RMSF of each residue, as provided by the
-rmsf option of the MDLovoFit (see the input
options section). The figure on the right displays the RMSF of the last
frame relative to the first frame, as a color scale plotted over the
structure. This figure is obtained with a script which is distributed
with MDLovoFit. For using it, three steps are required:
1. Load the aligned trajectory (the "output.pdb" file of the example
above) loaded in VMD. Then, in the VMD console, do:
vmd >  set user_data
./output.pdb
2. Then, run the user_field.tcl script, which is available
at the mdlovofit/src directory, using:
vmd >  source
/pathtomdlovofit/mdlovofit/bin/user_field.tcl
3. Finally, go to
Graphics -> Representations -> Coloring
Method
and chose
Trajectory -> User -> User2
This will color each residue at each frame of the trajectory with the
color corresponding to the RMSF of that residue at that frame. You can
adjust the scale in the Graphics->Colors menu of
VMD. Choose, for example, the BGR color scale, which was
used to build the figure above.
|
|
|
|